Socio-Economic and Profitability Analysis of Honey Marketing in Port Harcourt City Local Government Area of Rivers State, Nigeria – Research Paper
Dr. Ikechi Agbugba | Contributor on Agribusiness Topics
In Port Harcourt City, Rivers State, Nigeria, honey marketing holds significant untapped potential in a thriving global market worth billion. Despite rising demand for honey, local supply remains insufficient to meet this need, presenting a valuable opportunity for those involved in its trade.
Learn How to Leverage Your Story through our Story to Asset Framework.
This study explores the socio-economic dynamics and profitability of honey marketing in the region, shedding light on the characteristics of marketers, key channels, and constraints they face.
By analyzing factors like capital investment, marketing experience, and household size, the research provides insights into the factors driving profitability, offering crucial recommendations to enhance the honey trade in the area.
Co-Authors Of The Study
Ikechi Kelechi Agbugba, Sunday King Agbagwa, Youssouf Diabate, Department of Agricultural & Applied Economics, Faculty of Agriculture, Rivers State University, PMB 5080, Port Harcourt, Nigeria, College of Agriculture, Environment and Nutrition Sciences, Tuskegee University, Alabama 36088, USA.
Abstract
Honey marketing can generate up to 10 billion USD, since the cumulative values are a function of it and other hive products.
Considering its current domestic consumption rate in Nigeria being 380, 000 tonnes with a global price of about 4.5 billion dollars, less of it has been offered into the market against the heavy demand for it taking into consideration that the competition for it is increasingly becoming intense. There is therefore no significant reduction in the demand for honey.
Hence, the essence of the study is to analyse the profitability of marketing honey in Port Harcourt City Local Government Area of Rivers State, Nigeria.
See also The Nigerian Agricultural Renaissance: How You Can Fuel a Transformation in Agribusiness
The study, therefore, examined the socio-economic characteristics of honey marketers; measured the profitability analysis of the honey marketers; identified as well as the honey marketing channels; determined the effect of the socio-economic characteristics on the profitability of honey marketing; and ascertained the constraints to honey marketing in the study area.
Purposive sampling technique was used to select 100 honey marketers. Data were presented and analyzed using descriptive statistics such as percentages, frequency distribution, budgetary (or gross margin) analysis and regression Analysis.
The results indicated that 68% of the marketers were female, 92% received formal education and 39% of the respondents were between the ages of 31 – 40. Majority (48%) of the respondents had household size between 1–5 persons.
The highest marketing experience was between 11 – 15years at 45%. Majority (44%) of the respondents indicated that they were married, while 33% started with capital ranging from N 21, 000 to N30, 000. Results show that majority (100%) of the respondents were confronted with the problem of inadequate honey supply. More so, majority (67%) of the respondents were retailers.
The study further indicated that honey marketing enterprise was profitable with an average gross margin of N18, 223.3 per month. Regression analysis results showed that variables such as start-up capital, marketing experience, age and household size had significant influence on the profitability of honey marketing.
It was recommended that the government should ensure that road networks become efficient and pliable through the construction of new roads and rehabilitation of bad roads to better facilitates honey marketing mechanism.
See also Nigerian Cassava Production: How to Transform a Staple Crop into Africa’s Economic Powerhouse
Keywords: Honey, marketing, margins, profitability, Nigeria, DOI: 10.7176/JESD/11-6-01, Publication date: March 31st 2020.
INTRODUCTION
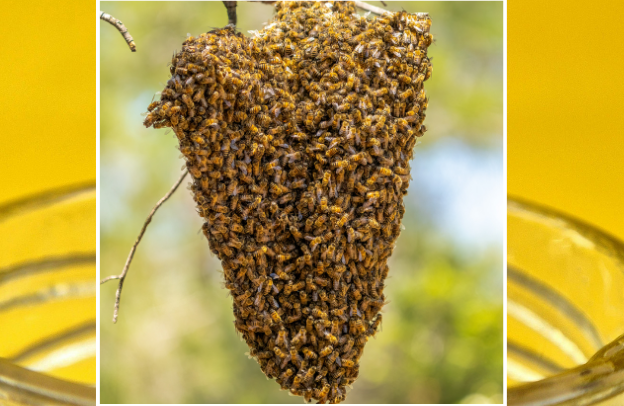
Honey can be described as the sticky, juicy and sweet-like substance obtained from the social and colonial insect called Honey bees, Aspismellifera (Muth, Francis and Leonard, 2016).
Honey bees are a subset of bees which fall into the order of hymenoroptera and sub-order aprocrita. The science and practice of exploiting bee products and services known as Apiculture has been in existence for thousands of years (Geldmann and González-Varo, 2018).
In various cultures of man, the use and importance of honey goes beyond its primary use as food (Geberetsadik and Negash, 2016). Honey is frequently used as a talisman and symbol of sweetness. Honey collection is an ancient activity. Kalayu et al. (2017) states that humans began hunting for honey about 10,000 years ago.
Men have been harvesting honey from wild nest for several years and it was discovered that honey crop can be obtained in a more convenient and easier way if bees are encouraged to nest in hives.
This however, led to the origin of beekeeping and management in hives. It is therefore, widely practiced in Nigeria and other countries of the world as a result of the extensive and magnificent importance of honey in the areas of food and medicine (Adeoti, 2014). Honey being a biological substance and intended for food and pharmaceutical use needs greater attention in quality and handling.
The quality of honey produced is of more concern to producers and consumers in attaining a good quality product. Effective handling of honey crop can be best achieved through an efficient marketing system (Kassa, 2017).
Unlike other non-timber forest product (NTFP), honey is exploited and marketed in large scale by the inhabitants of the Montane Forest of the Northwest Province (Paterson, 2004). Besides the income generating aspect of honey, its production contributes a great deal to human development by providing food, health and employment (Al-Ghamdi et al, 2017).
Honey can essentially, be mainly used in cooking, baking as a spread on bread, and as a supplement to various beverages such as tea and as a sweetener in some commercial beverages (Tarekegn et al., 2018).
Belet and Berhanu (2014) reported that some industries such as food, pharmaceutical and cosmetics as well brewery industries, depend on honey as part of their raw materials in production of their commodities, for instance drugs, body creams, lip balm, confectionaries, among others.
Folayan and Bifarin (2013) claimed that honey contains a diversity of substance which are indispensable of all living things. This claim is confirmed by the fact that honey is used in the treatment of various ailments such as cough, constipation, diabetes, sore, burns, indigestion, arthritis, to mention a few is used as elixir to relieve sore throat (Animene, 2007; Kassa et al, 2017).
Beekeeping generally is a complementary enterprise to virtually all farming enterprises in the study area. This provides insurance against risk and uncertainties that could result due to inclement weather and pest attacks.
For honey production to increase in a sustainable manner, the present level of beekeeping technology must be improved upon (Alattal and AlGhamdi, 2015).
See also Scarcity In Time Of Plenty: The Confusing Nigerian Scenario By Austin Isikhuemen.
The extra remarkable aspect of beekeeping is that it ensures for continuation of natural assets by the pollination of wind and cultivated plants. Honey is a delicacy that is widely consumed with many medicinal values, and beeswax has a number of industrial uses (Al-Ghamdi et al., 2016).
Trade in bee product has the potential for earning significant foreign exchange for Nigeria as the industry gains grounds. As reported by Folayan and Bifarin (2013), the relevance of honey to both the local, national and global economies cannot be over-emphasized. According to him, honeybees contribute $15bn to the value of US crops annually.
The use of bees in biological (non-pesticide) control of agricultural pests is also an industry generating $20m in the US per year. About $200m worth of honey is produced in the US annually while over $30m is made by American beekeepers from renting out bees for crop pollination.
The market for honey beverages in the US is worth about $195m per year aside the processing and packaging of honey-by products such as pollen, propolis and royal jelly as food supplements, which generate more than $1bn annually.
However, despite this enormous potential, not enough has been done to harness it yet (Federal Ministry of Agriculture and Rural Development, 2016).
Over the years, honey producing countries throughout the world are consuming more of their own honey production (Geberetsadik and Negash, 2016). This implies that less honey is offered in the world market against the heavy demand for this honey, and so the competition for this honey becomes intense.
There is no significant reduction in the demand for honey. This, therefore, is an indication that raw honey prices will remain strong and will most likely continue to increase throughout the years (Birhan et al, 2015).
However, the profitability of honey marketing depends on the quality and quantity of honey that is been produced into the market.
Objectives of the Study
The broad objective of the study is to examine the profitability of marketing honey in Port Harcourt City Local Government Area of Rivers State, Nigeria.
Specifically, the objectives of the study:
- examined the socio-economic characteristics of honey marketers;
- examined the profitability of honey marketing;
- identified the marketing channels of honey marketing;
- determined the effect of the socio-economic characteristics on the profitability of honey marketing; and
- identified the constraints of marketing honey in the study area.
MATERIALS AND METHODS
The study was carried out in Port Harcourt City Local Government Area, of which Port Harcourt is the capital of Rivers State, Nigeria. It lies along the Bonny River with longitude 605 550E and latitude 4047’21 N. and is located in the Niger Delta.
The area which was renamed by Federick Luggard after Lewis Vernon Harcourt in 1913 has a population of 1,382,592 persons (NPC, 2006).
It is pertinent to note that the area that became Port Harcourt in 1913 was originally from the farmlands of the Diobu village group of the Ikwerre ethnic nationality, which were predominantly farmers.
A multi-stage sampling technique was adopted followed by a purposive selection across the study area of which three (3) strategic markets (Rumu Wogi Mile One Market, Oruwuoroko Nkpolu Mile Three Market and Borokiri Town Market) were selected.
From the markets already selected, thirty-three (33) respondents were randomly selected from 2 markets, while thirty four (34) honey marketers were also chosen giving rise to a total of one hundred (100) respondents.
Table 2.1: Description of Sampling Method
| Community Market | Number of Respondents |
| Rumuo Wogi Mile One | 33 |
| Oruwuoruko Nkpolu Mile Three | 34 |
| Borokiri Town Market | 33 |
| Total 3 | 100 |
Primary source of data collection were the use of structured questionnaires, personal visits, contacts and interview of honey marketers. The analytical tools employed for the study were descriptive statistics, budgetary model and multiple regression analysis.
Objectives one, three and five were analyzed using descriptive statistics such as frequency and percentage, while Objectives two and four were analyzed using budgetary model and regression analysis.
Budgetary Model
Budgetary model was employed in determining the profitability of honey marketing in the area of study. The model specification is as follows:
- NI = TR – TC GM = TR – TVC
- TC = TVC + TFC Where
- NI = Net income from honey sales.
- TR = Total revenue from honey sales.
- GM = Gross margin from honey sales.
- TC = Total cost of marketing honey.
- TVC = Total variable costs from marketing honey.
- VC = Variable cost (cost of transportation, rent, purchase or cost of honey production etc.) TFC = Total fixed costs from marketing honey.
The Gross margin and Net-returns analysis could also be used in determining the profitability of honey marketing in the area. Gross Margin analysis (GM) is the difference between the Total Revenue (TR) and Total Variable Cost (TVC). GM = TR – TVC.
Note that when GM is greater than zero, it is a clear indication that the enterprise is profitable; whereas Net-Returns Analysis (NR) is the difference between the Total Revenue (TR) and Total Cost (TC), that is NR = TR – TC. Total revenue represents the sale of honey. Therefore, Total cost equals TVC + TFC.
Regression Model
Multiple regression analysis was used to analyse objective (iv). The linear equation was chosen based on its performance with respect to R2 value, F-ratio and conformity of most of the co-efficient signs to align with the apriori expectation.
The mathematical presentation of the explicit form of regression model is as follows;
- Y = bo + b1X1 + b2X2 + b3X3 + b4X4 + b5X5 + b6X6+ b7X7+ ei
- Where Y = Gross Margin (₦)
- bo = Intercept
- b1-b7 = parameter estimates
- X1 = Start-up capital (₦)
- X2 = Educational level (years)
- X3 = Marital status (dummy, 1= married, 0 = otherwise) X4 = Age (years)
- X5 = Sex (dummy, 1= male, 0 = otherwise)
- X6 = Household size (persons) X7 = Marketing experience (years)
- ei = error term
RESULTS AND DISCUSSION
Socio – economic characteristics of the respondents
Socio – economic characteristics of the honey marketers forms an important aspect of the study as it captured respondents’ ages, sex, marital status, educational level, household size, experience in marketing and start-up capital in the study area.
Table 3.1: Frequency distribution of respondents according to their socio – economic characteristics
| 20 – 30 | 28 | 28 | 45 years |
| 31 – 40 | 39 | 39 | |
| 41 – 50 | 20 | 20 | |
| 51 – 60 | 8 | 8 | |
| 61 – 70 | 5 | 5 | |
| Total Sex | 100 | 100.0 | |
| Female Male | 68 32 | 68 32 | |
| Total Marital status Married Single | 100 44 10 | 100.0 44 10 | |
| Widow/Widower | 11 | 11 | |
| Separated/Divorced | 35 | 35 | |
| Total Educational level | 100 | 100.0 | |
| No formal education | 8 | 8 | |
| Primary education | 32 | 32 | |
| Secondary education | 50 | 50 | |
| Tertiary education | 10 | 10 | |
| Total Household size | 100 | 100.0 | |
| 1 – 5 | 48 | 48 | 8household size |
| 6 – 10 | 33 | 33 | |
| 11 – 15 Total Marketing experience | 19 100 | 19 100 | |
| 1– 5 | 15 | 15 | |
| 6 – 10 | 34 | 34 | 13.5 years |
| 11 – 15 | 45 | 45 | |
| 16 – 20 21 – 30 | 5 1 | 5 1 | |
| Total Start-up capital ( | 100 25 | 100.0 25 | |
| 21,000 – 30,000 31,000 – 40,000 41,000 – 50,000 Total | 33 22 20 100 | 33 22 20 100 | |
Source: Field Survey, 2017
Regarding the age of the respondents as shown in Table 3.1, majority (39%) of the honey marketers fall within the ages of 31 and 40 years followed by 28% of the respondents who were between 20 and 30 years.
However, the results further indicated that 20% of the respondents fell within the ages of 41 and 50 years, while 8% of the respondents fell within the ages of 51 and 60 years, respectively. Only 5% of the respondents fell within the ages 60 and 70 years.
See also Kiwifruits Now Stand A Chance Against Canker Plant Disease!
This implied that marketers with ages of 31-40 years constitute majority of the marketers thereby exhibiting positive energy that could be directed to useful life (Kassa, 2017).
In relation to the sex of the respondents, Table 3.1 showed that majority (68%) of the respondents are female while 32% are male. This is an indication that females are the predominant honey marketers. 50-90% of marketing activities are carried out by women (Obi and Agbugba, 2016).
As indicated in Table 3.1, majority (44%) of the respondents are married, 35% separated/divorced while 11% are widowed. Only (10%) are single. This implies that men and women who are into honey marketing enterprise are responsible men and women who have family to cater for. Therefore, they require extra income to run their business.
Regarding the educational level of the respondents, the results from Table 3.1 shows that majority (50%) of the respondents had secondary education, 32% primary education, 10% had tertiary education, and 8% had no formal education.
This indicates that half (50%) of the marketers attained secondary education as their highest level of education. This implies that majority of the product marketers do not have the resources to get to greater/tertiary level of education (Agbugba and Thompson, 2015).
Household size of honey marketer is noted with moderate tendency ratio in Table 3.1. Majority (48%) of the respondents has household size between 1–5 persons, 33% have 6 – 10 persons and 19% have 11 – 15 persons.
The mean household size is 8 persons. This indicates moderate household size. It is obvious that moderate family size might enhance their ability to invest earnings in the business.
Experience is the act of gaining knowledge through practices of skill which brings about specialization. Those involved in honey marketing have enough experience on the profitability, status and challenges of honey marketing.
Albert and Charles (2015) observed that long years of experience in farming activities enable participants to have deeper knowledge of the business and how to overcome challenges.
From the results in Table 3.1, majority (45%) of the respondents indicated marketing experience between 11 – 15 years, followed by 34% with 6 – 10 years, 15% with 1 – 5years’ experience, 5% with 16– 20 years and 1% with 21– 30 years of honey marketing experience. The mean year of experience is 13.5 years. This indicates that honey marketers have been in it for almost 14 years and therefore have enough knowledge on honey marketing.
Start-up capital, also known as the initial outlay, is referred to as the amount of money or funds which is solely for the purpose of starting-up a business. From Table 3.1, results indicated that majority (33%) of the respondents started-up their honey business with a capital of N21,000– N 30,000, followed by 25% with N10,000– N 20,000, 22% with N31,000– N 40,000, and 20% with N41,000– N 50,000 start-up capital.
The mean start-up capital is N30,375. This indicates that honey marketing can be undertaken by an average person in the society with a startup capital of N30,375 and make huge profits that will help in alleviation of poverty and unemployment in the society.
Profitability of honey marketers
Costs and margins of the honey marketers can be defined as the difference between the producer and consumer prices of its equivalent quantity and quality.
From Table 3.2 which presents the profitability analysis of honey marketing, the results indicates that honey marketing was a profitable business. Therefore, in determining the profitability of honey marketing, total fixed cost of production was realized as N37,934.37.
Jhingan (2007) maintained that total fixed cost are those expenses of production which does not change with the change in output. In other words, the results show that the total variable cost of the product is N405,320 which implies that the sum total of the varying cost over time with the level of output, was at the given amount.
Hence, the assertion that total variable costs are second phase costs which vary with the level of output (Agbugba and Shelaby, 2017).
Table 3.2: Cost and Returns Analysis of Honey Marketing Enterprise
| Items | Amount ( |
| Total Revenue Amount of honey purchase Labour cost Transport expenses Containers cost Commissions/Fees Total Variable Cost (TVC) Gross Margin (GM) Average Gross Margin Depreciation of furniture Depreciation of filters Rent per annum Total Fixed Cost (TFC) Net Income | 624,000 360,000 18,320 5,000 6,000 16,000 405,320 218,680 18,223.3 483.44 1,450.93 36,000 37,934.37 180,745.63 |
Source: Field Survey, 2017
From Table 3.2, the total revenue in the table is given at N624,000 which indicates that the total receipts obtained by the product marketers from the sale of certain quantities of the commodity at various price was at the above amount.
According to Jhingan, (2007), total revenue is defined as the total sales proceeds of a firm by selling a commodity at a given price. The table further revealed that the average gross margin per marketer per month is N18,223.3.
See also Unlocking Nigeria’s Agribusiness Potential: A Call to the African Diaspora
This implies that honey marketing could be profitable, if the earning is compared with the minimum wage of about N18,000 per month. Honey marketing could therefore be said to be a worthwhile venture in the study area.
The net income from the marketing of honey according to the table was N180,745.63. This indicates the available income to the product marketers for future investment after operating expenses. Net income is the surplus of income over operating expenses (Reddy et al, 2009).
Honey marketing channels of the respondents
Marketing channel for honey marketing was rightfully identified. Channel comparison for the honey marketers was also done based on the responses of the marketers’ categories which included producers, wholesalers, retailers, among others. Results of the analysis is presented in Table 3.5.
Table 3.3: Distribution of Respondents according to their Marketing Channels
- Marketing channels Frequency (%)
- Roles in marketing of honey
- Producer 7 7
- Wholesaler 26 26
- Retailer 67 67
- Total 100 100
- Source of getting honey
- Farm 7 7
- Producer 70 70
- Intermediaries 23 23
- Total 100 100
- Honey customers
- Wholesalers 7 7
- Retailers 18 28
- Consumers 100 100
Source: Field Survey, 2017
Entries in Table 3.3 show that the majority (67%) of the respondents are retailers in the marketing of honey. This is so because most of the customers are consumers who prefer to buy in small quantities from the retailers for consumption purposes and also the start-up capital of a retailer is lower compared to a wholesaler, thus attracting more people.
Also, a large number (70%) of the marketers obtained their supply of honey from the producers. This may be because they want to avoid the exploitative tendencies of the middlemen, while 100 percent of the respondents have consumers as their customers, this may be due to the awareness of the importance of honey to human health.
Effect of Socio-Economic Status on the Margins of the Wholesalers
With regards to determining the effect of the socio-economic characteristics of the respondents on the profitability of honey marketers, linear regression analysis was conducted and reported in Tables 3.4 accordingly.
Table 3.4: Regression Analysis
| Model Summary & Fitness | Parameters | Linear |
| Multiple R Square (R2) | 0.5915* | |
| f-ratio | 74.9742* | |
| P-value of the f. ratio | 0.329* | |
| Coefficient estimates | Variables | |
| B0 | Intercept | 2999.19(9363.58)ns |
| B1 | Start-up capital | 330.41(2.24)** |
| B2 | Educational Level | 9.99(0.11)ns |
| B3 | Marital status | 53.13(0.55)ns |
| B4 | Age | 69.56(4.55)** |
| B5 | Sex | -79.94(65535)ns |
| B6 | Household size | -563.60(-0.29)** |
| B7 | Marketing Experience | 63.89(1.68)** |
*Figures in parentheses are t ratios **=Significant influence (P<0.05) NS=Not significant (P>0.05) * Source: Field Survey, 2017
From the result of the linear regression in Table 3.4, R2 is 0.5915 while the F-value is 74.9742. The model shows that start-up capital (330.41), Marketing experience (63.89), Age (69.56) and household size (-563.60) were significant at P≤0.05.
This implies that profitability of honey marketing is significantly influenced by start-up capital, marketing experience, age and household size. A large household size requires more money to feed, so the marketers will need more money to support and take care of the family by venturing into honey marketing.
Since most of the socioeconomic characteristics considered were statistically significant at five percent level of probability, the alternative hypothesis is accepted which states that Socio-economic characteristics of honey marketers have significant influence on the profitability of honey marketing.
Linear model
Results of the linear model can be presented thus: Y= 2999.19 + 330.42x1 + 9.99x2 + 53.13x3 + 69.56x4 + -79.94x5 + -563.60x6 + 63.89x7 + 1729.52 (R2=0.5915).
It indicates that the coefficient of determination (R2) is 0.5915 and can be approximated to 0.59, implying that 59% of the variations in honey marketing caused by start-up capital, educational level, marital status, age, sex, household size and marketing experience were explained in the model, while the remaining 41 percent are not explained in the model, but captured by the error term.
Constraints to Honey Marketing
From the findings of the study, the major constraints to honey marketing includes: problem of storage, honey spoilage, poor road network, fluctuation in prices, robbery and inadequate honey supply.
See what people also read Cassava Starch: A Golden Opportunity for African Entrepreneurs in the Global Agribusiness Landscape
It is pertinent to note that the constraints to honey marketing were highlighted based on the multiple responses of the respondents. Table 3.5 captured the results.
Table 3.5: Distribution of Constraints to the Marketing of Honey
![]() Constraints
Constraints
| Storage problem Problem of honey spoilage Poor road network Price fluctuation Problem of robbery Inadequate supply of honey | 89 5 91 60 4 100 | 89 5 91 60 4 100 |
Source: Field Survey, 2017
The table indicated that 89% of the respondents identified storage problem as a serious constraint in honey marketing, while as little as 5% of the respondents identified honey spoilage as a problem.
More so, 91% of the respondents identified poor road network as one of the constraints facing honey marketing. Generally, it is evident that many developing countries lack good roads.
Hence, this finding agrees with that of Reddy et al (2009) which opined that one of the pressing problems of agricultural marketing is the lack of adequate transport services which is mainly caused by poor access roads. In other words, results further showed that 60% of the respondents were confronted with the problem of price fluctuation.
This is because fluctuation in the availability of honey supply may result to seasonal problems which could lead to scarcity of honey during some certain periods of the year. In the same vein, 4% of the respondents considered robbery as a problem.
Virtually all (100%) the respondents identified inadequate supply of honey as a major constraint to honey marketing.
This implies that most of the honey marketers were usually in poor supply and as such this has imposed a serious challenge to the commodity marketers. Similarly, Reddy et al (2009) asserts that decrease in honey supply meant less supply of it at the same price.
CONCLUSION
The study results indicated that honey marketing is profitable with substantial net income of sales per year supporting a commensurate average gross margin income per individual/month.
The multiple regression analysis showed that the profitability of honey marketing is significantly influenced by start-up capital, marketing experience, age, and household size.
See also Unlocking Nigeria’s Agribusiness Potential: A Call to the African Diaspora
Since the results showed that the majority of the marketers in the study area were female who are married and middle-aged, it presupposes that honey marketing could be the livelihood upon which their households are supported.
The results further confirmed that the majority of the respondents were confronted with the problem of an inadequate supply of honey.
Moreover, since the results indicated that majority of the respondents engaging in honey marketing are retailers, it could therefore be justifiably concluded that retailers play a key role in honey marketing in the study area.
RECOMMENDATIONS
In view of the results and conclusion from the study, it is imperative to make recommendations to improve the efficiency of honey marketing in the study area.
- There should be an increase in the production of honey so that, the supply of honey can consequently increase in the market for the marketers to purchase and make a profit.
- The government should ensure that road networks become efficient and pliable through the construction of new roads and rehabilitation of bad roads to better facilitate honey marketing mechanisms.
- Creation of honey-specialized centres will be imperative for the improvement of the marketing skills as well as processing and production know-how of those concerned.
- Security should be adequately provided in society so that cases of robbery of honey marketers will be avoided.
- Honey marketers should form unions at the state and national levels to fight against the problem of price fluctuation.
REFERENCES
- Adeoti A.I., Issack B., Oluwatayo S., Raheem O. (2014). Determinants of market participation among maize producers in Oyo state, Nigeria. Brit. J. Econ. Manage. Trade, 4(7):1115-1127
- Agbugba, I.K. and Shelaby, A. (2018). Marketing Analysis of Selected Vegetables in Port Harcourt Metropolis Rivers State, Nigeria, IOSR-Journal of Agriculture and Veterinary Science (IOSR-JAVS), 11(2), 26-34 Agbugba, I.K. and Thompson, D. (2015). Economic Analysis of Tropical Leafy Vegetables in South-East Nigeria: The Case of Rural Women Farmers, American Journal of Agricultural Sciences, 2 (2), 34-41
- Alattal Y. and AlGhmadi, A. (2015). Impact of temperature extremes on survival of indigenouys and exotic honeybee subspecies, Apis mellifera, under desert and semi-arid climates, Bull. Insect, 68 (2), 219-222.
- Albert, C.O. & Charles, G.H. (2015). Urbanization on sustainable livelihood of women in Port Harcourt Metropolis, Rivers State, Nigeria. Agricultural Practice and Science Journal, 2-3(89), 165-174.
- Al-Ghamdi, A.A., Nuru, A., Awraris G. and Yilma, T. (2016). New approach for determination of an optimum honeybee colonies carrying capacity based on productivity and nectar secretion potential of bee forages species, Saudi Journal of Biological Sciences, 23 (1), 92-100.
- Al-Ghamdi A.A., Nuru A, Herab, A.H. and Ansari M.J. (2017). Comparative analysis of profitability of honey production using traditional and box hives, Saudi Journal of Biological Sciences, 24, 1075-1080.
- Animene, C.P. (2007). Economic analysis of honey production in Edo state Nigeria. An Unpublished HND Research Report at the Department of Agricultural Extension and Management, Federal College of Agriculture, Akure, Ondo State, Nigeria.
- Belet G. and Berhanu G. (2014). Perceptions of smallholder farmers on improved box hive technology and its profitability in Northern Ethiopia, Journal of Agricultural Extension and Rural Development, 6 (12), 393402.
- Birhan M, Sahlu S, Getiye Z (2015) Assessment of challenges and opportunities of beekeeping in and around Gonder. Academic Journal of Entomology, 8, 127-131.
- Federal Ministry of Agriculture and Rural Development (2016). The Agriculture Promotion Policy (2016 – 2020) Building on the Successes of the ATA, Closing Key Gaps Policy and Strategy Document, Accessed at:
- http://fscluster.org/sites/default/files/documents/2016-nigeria-agric-sector-policy-roadmap_june-152016_final1.pdf on 03/07/2018
- Folayan, J.A. and Bifarin, J.O. (2013). Profitability analysis of honey production in Edo North
- Local Government Area of Edo State, Nigeria, Journal of Agricultural Economics and Development, 2(2), 60-64
- Geberetsadik T, Negash D (2016) Honeybee Production System, Challenges and Opportunities in Selected Districts of Gedeo Zone, Southern Nation, Nationalities And Peoples Regional State, Ethiopia. International Journal of Research Granthaalayah 4, 49-63.
- Geldmann J. and González-Varo, J.P. (2018). Conserving honey bees does not help wildlife Science, 359 (6374), 392-393.
- Jhingan, M.L. (2007). The Economics of Development and Planning, 39th Edition. Vrinda Publications (PD Ltd. Delhi).
- Kalayu A, Wondifraw Z. and Tiruneh W. (2017). Beekeeping Practice and Honey Production in North-East Dry
- Land Areas of Amhara National Regional State, Ethiopia, Poultry, Fishes and Wildlife Sciences, 5 (2), 1-12.
- Kassa T (2017). Structure and Conduct of Honey Market in Chena District Kaffa Zone, Southern Ethiopia; World J. Agric. Sci. 13(1), 4552.
- Kassa T, Gonche G Amenay A (2017). Value Chain Analysis of Honey in Kaffa and Sheka Zones of SNNPR, Ethiopia. Int. J. Res. Agric. Sci., 4(3), 142-148.
- Kassa T., Jema H. and Bosena T. (2018). Factors affecting market supply of honey in Chena district, Kaffa zone, Southern Ethiopia, Journal of Development and Agricultural Economics, 10(3), 99-109
- Muth F., Francis J.S. and Leonard, A.S. (2016). Bees use the taste of pollen to determine which flowers to visit, Biol. Letters, 12 (7), 1-4.
- NPC (2006): National Population Commission, Provisional Census Figure of Nigeria.
- Obi A. and Agbugba I.K. (2016). Causality and Integration Analysis of Dry Season Tropical Leafy Vegetable Markets in South-East Nigeria, Paper presented at the 10th Africa Farm Management Congress, Pointe aux Piments, Mauritius, 20-25 November, 2016.
- Reddy, B.V.S., Ramseh, S., Sanjana R. P. And Ashok, K.A. (2009). Genetic enhancement for drought tolerance in sorghum, Plant Breeding Reviews, 31, 189-222.
Learn How to Leverage Your Story through our Story to Asset Framework.